There seems to be an ongoing narrative in Ann Arbor about “growth” and “development” that labels what’s transpired here as something of a boom town, an area of unchecked and rampant development that threatens the very fabric of our community. People see the retail and rooftops at the edges and perhaps most importantly the shiny new buildings downtown and the perception is we are experiencing a period of high growth, particularly in this extended period of economic expansion following the Great Recession. This has rankled me for some time because here’s the thing: it’s not even close to true.

I pulled data from a number of places to illustrate. One caveat here, the definition of Ann Arbor and the area is different depending on the data source and period of time. For the purposes of this post, I am largely focusing on the city of Ann Arbor and adjacent townships and leaving aside Ypsilanti for now. Thus subject market area is Ann Arbor, Ann Arbor Township, Barton Hills, Scio Township, Lodi Township, Pittsfield Township, and Superior Township, generally encompassed in Zip Codes 48103, 48104, 48105, 48108, and 48109. First, just for a sense of bearing, here is the population for that selected geography:
| Year | Population | 10 Year Growth |
| 1900 | 20,994 | |
| 1910 | 20,656 | -1.61% |
| 1920 | 24,958 | 20.83% |
| 1930 | 35,471 | 42.12% |
| 1940 | 45,074 | 27.07% |
| 1950 | 76,597 | 69.94% |
| 1960 | 93,375 | 21.90% |
| 1970 | 130,785 | 40.06% |
| 1980 | 146,900 | 12.32% |
| 1990 | 159,480 | 8.56% |
| 2000 | 186,174 | 16.74% |
| 2010 | 197,252 | 5.95% |
| 2020 | 221,471 | 12.28% |
This data is from SEMCOG and that rosy 2020 number is obviously a projection but let’s say it holds true. The average growth over the last 100 years has been 23.99% per decade, 25.32% since WWII. Thus this decade, while a pickup from the previous 10 year period would still be half the population growth of an average decade. Hardly a “boom town”.
I also looked at development, both across all types and just focused on housing. Here is housing permit data, also from SEMCOG.
| Year | Single Family | Two Family | Attach Condo | Multi Family | Total Units |
| 2000 | 850 | 10 | 163 | 63 | 1,086 |
| 2001 | 708 | 34 | 202 | 287 | 1,231 |
| 2002 | 624 | 8 | 414 | 120 | 1,166 |
| 2003 | 733 | 12 | 507 | 56 | 1,308 |
| 2004 | 646 | 12 | 370 | 217 | 1,245 |
| 2005 | 456 | 4 | 301 | 101 | 862 |
| 2006 | 186 | 12 | 114 | 64 | 376 |
| 2007 | 146 | 12 | 228 | 107 | 493 |
| 2008 | 93 | 4 | 21 | 100 | 218 |
| 2009 | 74 | 6 | 4 | 165 | 249 |
| 2010 | 125 | 2 | 35 | 0 | 162 |
| 2011 | 121 | 2 | 0 | 321 | 444 |
| 2012 | 165 | 4 | 22 | 348 | 539 |
| 2013 | 223 | 0 | 78 | 342 | 643 |
| 2014 | 202 | 4 | 21 | 440 | 667 |
| 2015 | 220 | 4 | 38 | 464 | 726 |
| 2016 | 244 | 4 | 66 | 347 | 661 |
| 2017 | 214 | 2 | 181 | 487 | 884 |
| 2018 | 284 | 0 | 206 | 764 | 1,254 |
| 2019 | 205 | 36 | 32 | 457 | 730 |
| 2000 to 2019 totals | 6,519 | 172 | 3,003 | 5,250 | 14,944 |
This data is readily accessible in just the last two decades (I will continue mining for further back and will post an update) but it’s obvious that in recent times, current housing permits are no anomaly and certainly down from the early 2000’s, up from the recession.
Here is data compiled from CoStar regarding multi-family properties and year built.
| Era | All Units | Market Rate Units | Student Units |
| Pre-1900 | 239 | 217 | 7 |
| 1900-1909 | 923 | 791 | 126 |
| 1910-1919 | 303 | 271 | 32 |
| 1920-1929 | 332 | 229 | 103 |
| 1930-1939 | 51 | 51 | 0 |
| 1940-1949 | 31 | 25 | 5 |
| 1950-1959 | 1,221 | 800 | 4 |
| 1960-1969 | 9,907 | 8,188 | 984 |
| 1970-1979 | 10,926 | 8,171 | 494 |
| 1980-1989 | 4,524 | 3,916 | 120 |
| 1990-1999 | 3,546 | 2,717 | 48 |
| 2000-2009 | 1,599 | 614 | 692 |
| 2010-2019 | 2,646 | 1,080 | 1,203 |
| Total | 36,248 | 27,070 | 3,818 |
Boom town appears to be from 1960 to 1980 here. The only thing that has really picked up is student housing which will be covered in more detail below.
Here is square footage of all commercial properties that CoStar tracks by year built. Again, recent development across the area approaching half of historic highs and down significantly from even recent years.
| Era | Square Feet |
| Pre-1900 | 711,000 |
| 1900-1909 | 1,900,000 |
| 1910-1919 | 364,000 |
| 1920-1929 | 100,000 |
| 1930-1939 | 477,000 |
| 1940-1949 | 736,000 |
| 1950-1959 | 2,300,000 |
| 1960-1969 | 13,500,000 |
| 1970-1979 | 11,700,000 |
| 1980-1989 | 11,400,000 |
| 1990-1999 | 11,200,000 |
| 2000-2009 | 8,300,000 |
| 2010-2019 | 6,000,000 |
It’s pretty clear from just about any relevant piece of data that Ann Arbor is not experiencing some sort of out-sized development boom. In fact, growth is relatively modest historically, a far cry from even recent times. The 1960’s and 1970’s was a legitimate boom, relatively speaking.

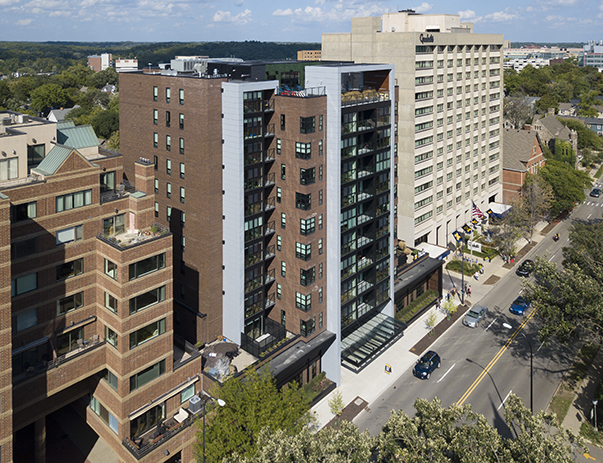
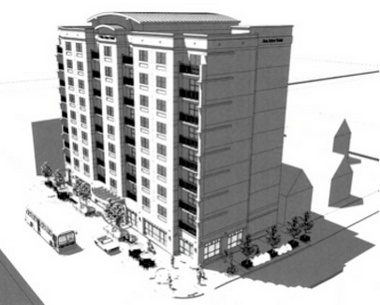
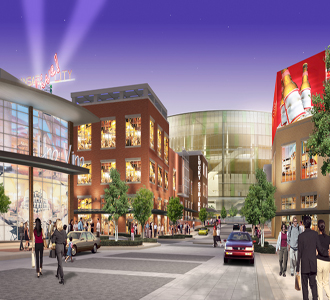
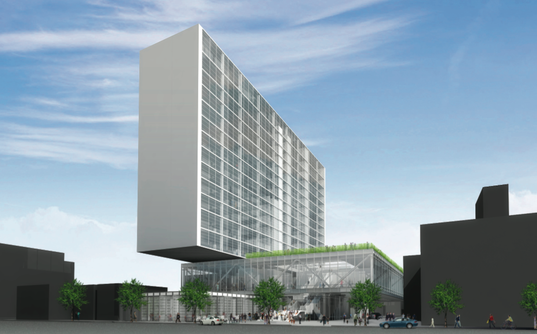
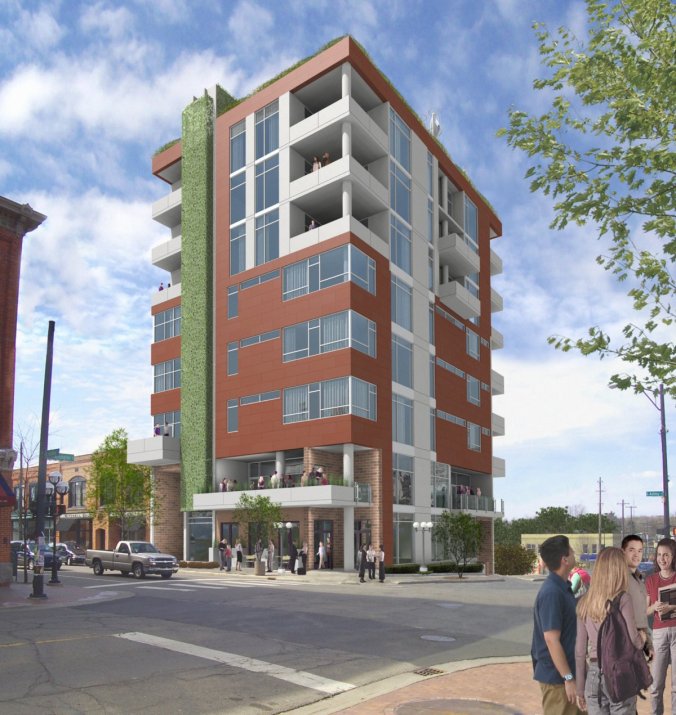
No analysis would be complete without looking at the one outlier, likely the one driving the conversation the most, that being student housing. Since 2000, there have been 1,842 units of student housing added, representing 5,197 beds. In just the past decade, nine private high-rise student housing projects have been completed in the greater downtown area, dramatically changing the skyline. However, it’s important to note that the university enrollment has grown by 8,613 students since 2000. Even adding in the university’s new dorms, North Quad (450 capacity) and Munger Graduate Residences (630 capacity) there’s still 2,366 more students than beds built over the same time period. Furthermore, all of those developments are walking distance to campus with limited parking and are scheduled to pay annual real estate taxes of nearly $17,000,000(!). In short, if you’re an Ann Arbor resident, those projects are the just about the best thing that can happen, housing students close to campus, keeping cars off the road, and paying boatloads of taxes.
As always, to each his or her own but the data doesn’t lie.