A lot has been made of high rental rates here in Ann Arbor, I even undertook a review of the state of the student housing rental market just last month (spoiler alert: the rent, occupancy and rate growth is bananas). However, this issue is not unique to our town, rents are skyrocketing virtually everywhere. Being the data junkie that I am (and having access to this sort of data at my day job), I wanted to take a look at how the Ann Arbor MSA stacks up to other markets in terms of rental rates and growth. I pulled information on 65 different Midwest markets and for good measure, I also looked at population growth, unemployment rates and inventory changes from 2012 to 2017. I last took a statistics class my sophomore year of high school so I’m certainly missing some significant conclusions but I’ll offer up a few observations that stand out to me.
As it relates to Ann Arbor specifically, our community posted the sixth highest rental rate at an average of $909 per unit, Chicago is first at $1,046. A2 is tied for the third lowest vacancy rate at just 3% trailing Appleton, WI and Jackson, MI(!). The five year rent growth of 20.13% is fourth, firmly planted in with the bigger metros of Kansas City, Columbus, Grand Rapids, Chicago and Minneapolis. This seems to be driven in part by a supply side gain of just 2.82%, only two other markets with any type of population growth, Kalamazoo and Elkhart, added less. For those that think Ann Arbor is going through a revolutionary development boom, we’re actually doing less than most of our neighbors.
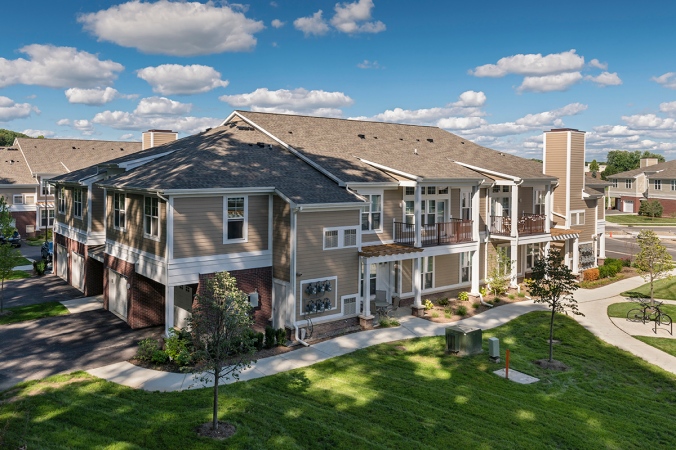
Oakcliff Apartments, 217 units added to the supply side in Ann Arbor in 2015.
In general, college towns are growing, factory towns are not. No shock there. Of the top 10 growth metros, 8 have a major university. The areas bleeding population include Flint and Saginaw here in Michigan, Youngstown, OH and Rockford, IL.
The Great Plains are the place to be. Markets in Iowa, Minnesota and Nebraska seem to be fairing extremely well. Strong population growth, extremely low unemployment and impressive rent growth.
Supply side growth, or lack thereof, is an obvious major factor in rent growth. Certain markets with no new inventory like Elkhart, Jackson or Muskegon actually saw strong rent growth despite lack of population growth and lagging employment. There is a somewhat strong correlation (see Dr. Elzinga, paid a little attention in stats) between supply growth and rent growth although not between supply growth per capita and rent growth. I suspect that a sizable percentage of rent growth is inorganic in that it’s coming from high new construction rents rather than rising existing rents. Certainly rents are going up in existing buildings as well but markets with a lot of new construction skew the numbers upward.
All in all some thought provoking data. Interested to hear other’s conclusions.
Note: All rent, inventory and occupancy data sourced from CoStar Group.

Ann Arbor does not have a population in excess of 360,000 what is the source for these numbers? Is this a “greater Ann Arbor area market” figure?
LikeLike
Yes, I will make that more clear, these are Metropolitan Statistical Areas, for Ann Arbor that is all of Washtenaw County.
LikeLike
This is very interesting. As Jeff notes, the population figure does not match for the City of Ann Arbor. This must surely be the MSA (which is what census figures would refer to unless the City is specifically called out). In other words, the entire Washtenaw County. If the other figures are from there as well, it would be reflecting growth or lack of it in Ypsilanti, Scio, Pittsfield. There has been a fair amount of building in some of our adjoining townships. So the numbers must mostly reflect our immediate region.
This is frequently a problem with national comparisons because the name of our MSA is “Ann Arbor” and you get such headlines as “Ann Arbor one of most inequitable locations in the US”, when what you are really comparing is Barton Village and Augusta Township, along with all the other localities in the county.
Thanks for pulling this together.
LikeLike
Yes, there’s no perfect answer here. I may try and pull data for just the cities themselves in a future post. There will always be an artificial dividing line, typically a city or county boundary. I would consider apartments built in Scio or Pittsfield Township very much part of Ann Arbor versus something in Chelsea or Manchester but they’re all linked.
LikeLike
I’ll look forward to the future analysis. Just to note, the school district boundaries are important for some demographics. It was important to me because it is also the AADL boundary line.
LikeLike
I’ll add on to the previous comments regarding the Ann Arbor data specifically as compared to the “greater Ann Arbor area;” Washtenaw County. Ann Arbor like many college towns doesn’t really conform to standard models since they have an influx of students which in our case represents a 50% increase in the cities active population. Even with this additional population, pushing us from say 116,000 to 166,000, the city at best would only be 50% of the said ~320,000 of the county as a whole.
Just as the county often times dislikes decisions that are made for the flip side of this forced grouping, it would be much more applicable in determining actual impact to the residents of Ann Arbor, if this data could be dissected a bit…
Thanks for a thought provoking blog,
GCG
LikeLike
Relative to population growth rate for the US overall compared to past decades, the current wave of construction is probably above average.
LikeLike
Pingback: Critique: 5 Reasons why MAGA Never Made Any Sense | Can You Believe That Guy?!